Notes on product judgment, technical systems, and shipped interfaces.

Building a Family Dashboard: 18 months of self-hosted reality

This is the deeper story behind my Family Dashboard project. The case study shows the product at a high level; this note focuses on what it took to make the dashboard useful in daily life for more than 18 months.

The real problem

When we relocated to Switzerland with kids, we had to relearn ordinary routines: school schedules, weather decisions, public transport timing, recycling days, activities, appointments, and everything that happens before leaving home.

The problem was not that information was unavailable. It was scattered across calendars, weather apps, transport apps, school notes, and memory. We needed the right context in the right place at the right moment.

That is why the dashboard lives by the entrance door. It is visible exactly when someone is putting on shoes, checking whether to take an umbrella, or figuring out whether the tram leaves in 3 minutes or 13.

Product decisions that mattered

The dashboard had to be ambient, not another app to manage. It needed to be readable from a few steps away, reliable in the morning, and simple enough for kids to understand.

The strongest decisions were not visual details:

  • Put the screen where decisions happen.
  • Aggregate data server-side so the interface stays simple.
  • Cache or degrade gracefully when external APIs fail.
  • Show fewer things, but make them more relevant.
  • Design for a cheap always-on device, not a powerful desktop browser.

Why self-host

I initially considered a hosted setup, but local hosting made more sense for this use case.

The dashboard runs on a Raspberry Pi, displayed on a used Kindle Fire HD. That gave me more control over local data, uptime, maintenance, and future smart-home integrations. It also forced a more practical architecture: if something breaks at 7 AM, I need to understand and fix it.

The setup:

  • SvelteKit frontend
  • Node.js data layer
  • Raspberry Pi hosting
  • Google Calendar integration
  • weather and Swiss transport APIs
  • custom 3D-printed wall mount

API aggregation

The first version tried to fetch too much directly from the frontend. That made loading states and errors harder than they needed to be.

The better model was a backend aggregation layer. The server gathers weather, calendar, transport, and routine data, then returns one clean response to the dashboard UI.

That pattern made the product easier to maintain. It also made failures easier to handle. When an external API changes or fails, the interface can show cached data, stale-data indicators, or partial content instead of simply going blank.

Designing for daily reliability

An always-on household product changes the design priorities. It is not enough for the interface to look right in a demo. It has to stay useful after weeks of automatic refreshes, API changes, Wi-Fi issues, and hardware limits.

The Kindle Fire constraint was especially useful. Weather animations had to be efficient enough not to slow the device down over time. The final approach uses a limited set of animation elements that can be reused instead of constantly creating expensive effects.

The lesson was clear: constraints made the product better. A cheap display forced better performance, simpler states, and a more disciplined interface.

Family user testing

The dashboard is used by people with different priorities. I care about transport timing and work events. My wife cares about school routines and family logistics. Our kids need visual cues they can understand without reading every label.

Internationalization was also more than translation. Supporting English and Russian meant dealing with different wording, typography, and assumptions about what information matters first.

This is where the project became more than a technical exercise. It forced real product judgment: what should be visible, what should be hidden, what should be local, and what should be understandable at a glance.

What changed at home

After 18+ months, the dashboard became part of our household routine.

It helped reduce morning stress, gave our kids more independence, and made our transition to Swiss life smoother. The product works because it is built around a real recurring decision point, not because it has many features.

The most useful part is still simple: shared context, always visible, exactly where we need it.

What I would do earlier next time

I would add basic health checks from day one. When a family depends on something every morning, you need to know when data is stale or a service is down before someone asks why the screen is wrong.

I would also formalize API adapters earlier. External services change. A small adapter layer is cheaper than letting each UI component learn every provider’s quirks.

Why this matters for product work

Family Dashboard is a personal project, but it proves the same pattern I care about in professional work: a useful product starts with system understanding.

The system here included family routines, transport timing, weather, school schedules, hardware limits, APIs, languages, and the physical location of the screen. The interface only worked after those constraints were understood.

That is the same shape of problem I enjoy most: turn a messy technical and human system into something people can trust and use.

Notes on the 2025 ICP Dashboard update

Archived note

This page is a personal preservation summary of DFINITY's Medium article, Internet Computer Dashboard: Making ICP Data More Accessible, published on April 25, 2025.

It keeps the main context and screenshots in case the Medium post moves or disappears. The original article remains the canonical source.

Internet Computer Dashboard overview screen from DFINITY's April 2025 Medium article

What the update was about

The article describes a broader product direction for the Internet Computer Dashboard. The dashboard has existed as a place to inspect live network data, historical metrics, subnet information, and activity across the Internet Computer. The 2025 update moved it toward a clearer, more connected product: less of a collection of separate data pages, and more of a structured way to understand the network and the ecosystem around it.

The main product shift was information architecture. DFINITY reorganized the dashboard so that different kinds of data are easier to find and easier to connect mentally. Instead of treating infrastructure, subnets, tokens, projects, and ecosystem activity as isolated views, the new direction tries to make the relationships between them more visible.

The updated navigation was designed around the most important user paths. A developer, researcher, token holder, or ecosystem participant should be able to move from a broad overview into specific details without needing to already know where every metric lives.

Updated Internet Computer Dashboard navigation and information architecture

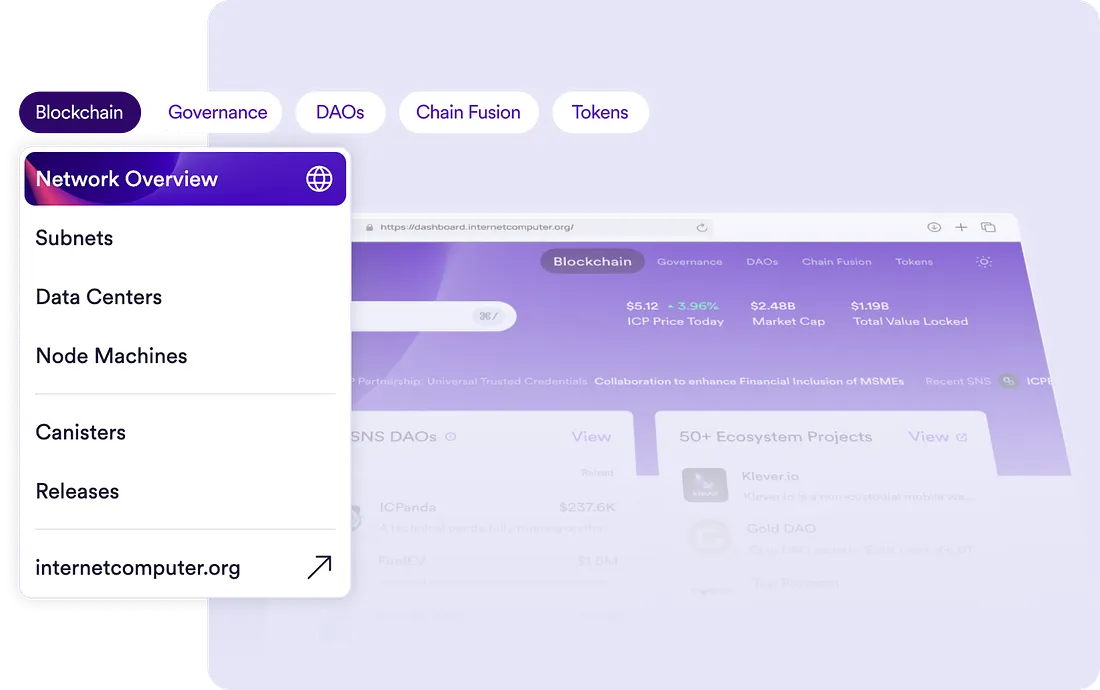
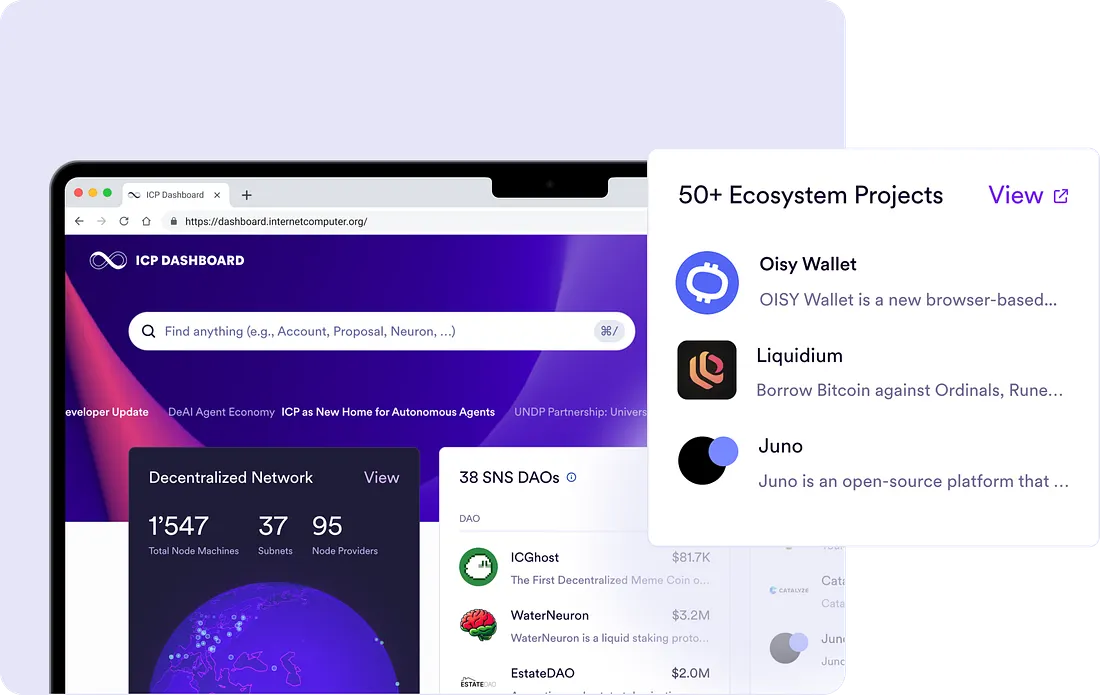
The homepage also became more important. Rather than acting only as a technical entry screen, it now introduces the wider Internet Computer ecosystem. The article mentions network statistics, projects, tokens, and events as elements that can help users understand not only the protocol, but also the activity happening on top of it.

Internet Computer Dashboard homepage with network and ecosystem information

Network and subnet views

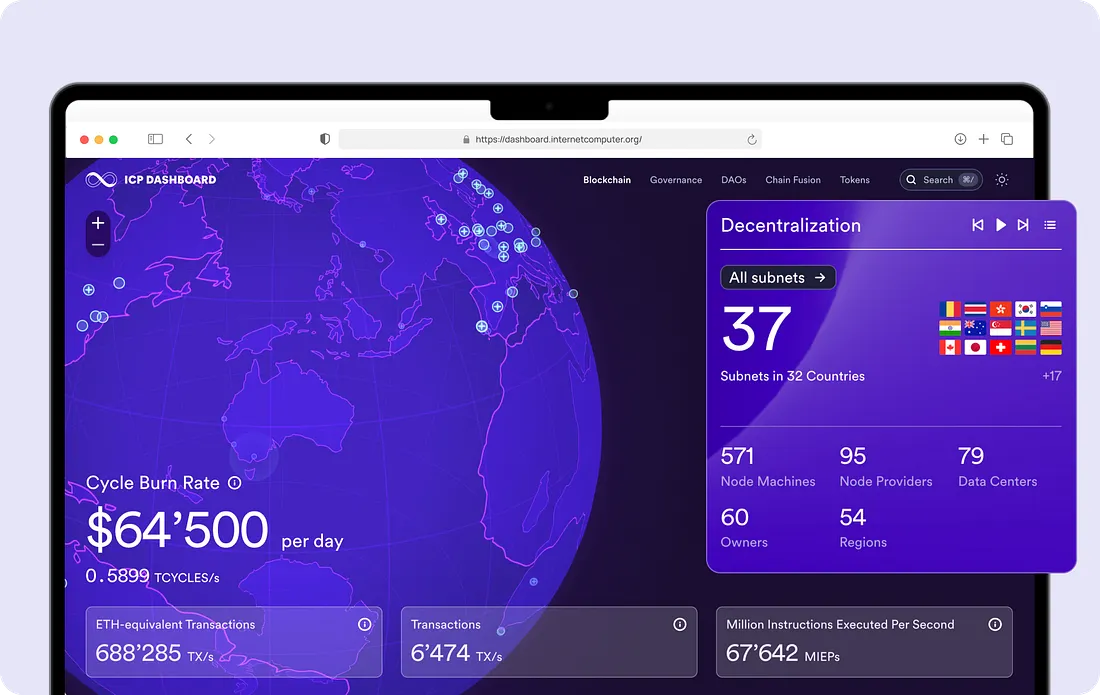
The network section was updated to make infrastructure easier to explore. It gives users a way to move through subnets and understand how the network is distributed across node machines, node providers, data centers, and geographies.

Internet Computer Dashboard network page showing subnet and infrastructure information

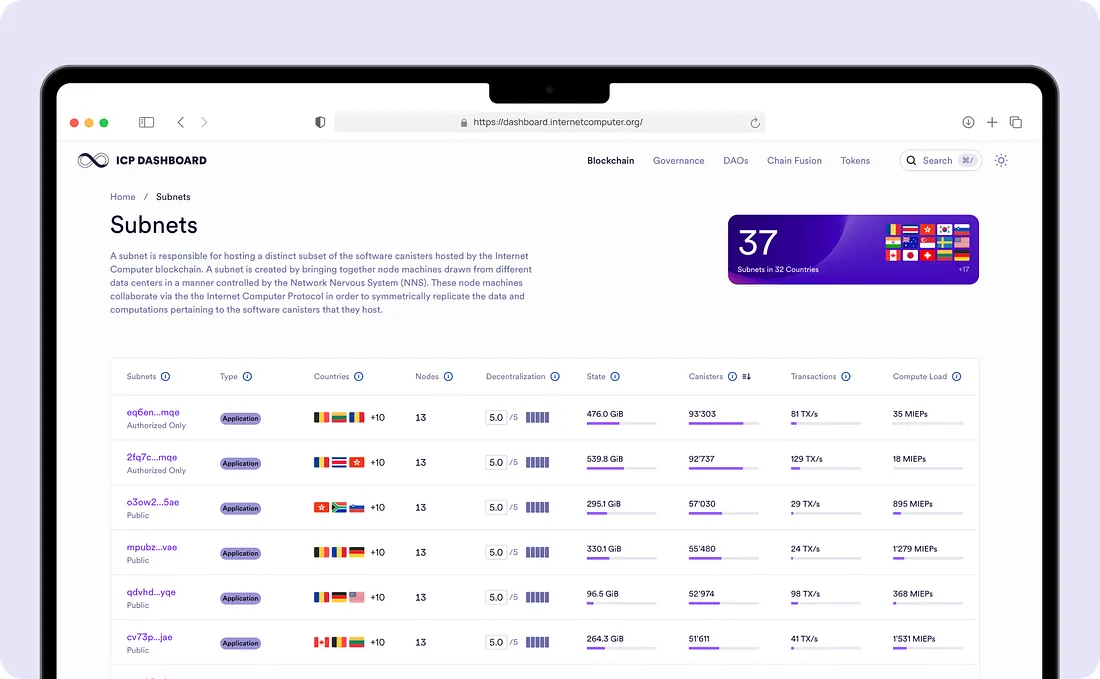
The subnet experience is especially important. The article highlights clearer subnet layouts with signals such as canister counts, transaction rates, load, geography, and decentralization indicators. The intent is to make subnet comparison faster: users can see where workload is concentrated, how balanced a subnet is, and what kinds of applications are running there.

Internet Computer Dashboard subnet detail view with decentralization indicators

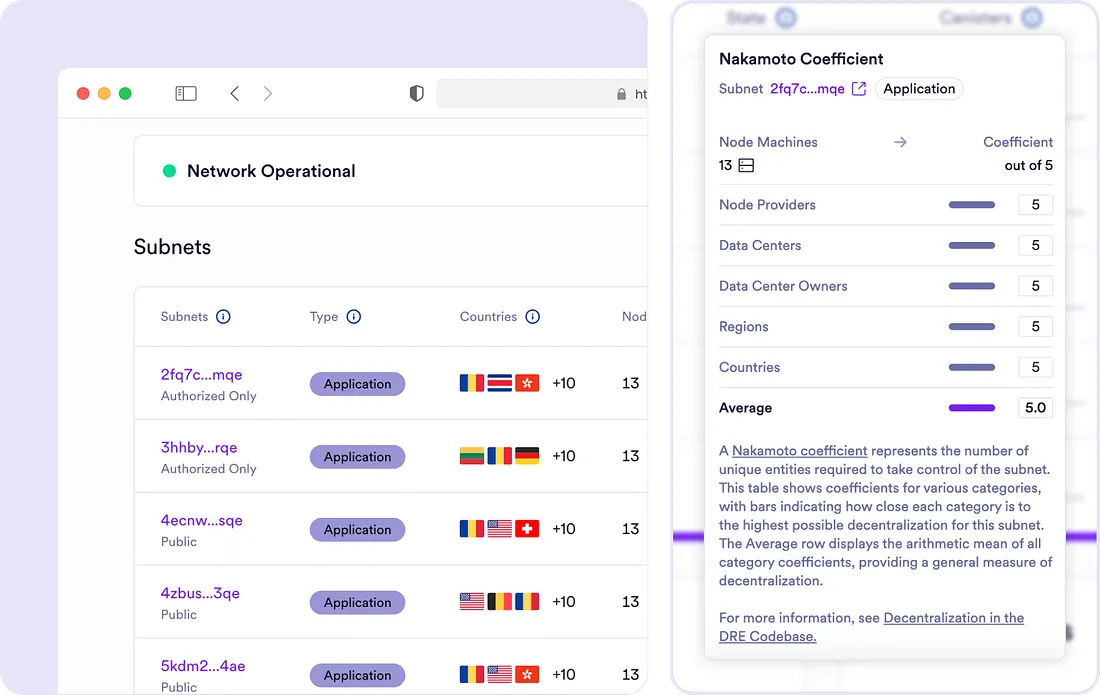
For a technical network like the Internet Computer, this matters because raw infrastructure data can be hard to interpret without context. A dashboard that shows distribution, load, and decentralization in one place makes it easier to reason about network health and usage.

Internet Computer Dashboard subnets page comparing subnet activity and load

Ecosystem tokens

Another major part of the update is the token section. The article describes early support for chain-key tokens such as ckBTC and SNS tokens, with a direction toward broader ecosystem token coverage.

Internet Computer Dashboard tokens page with chain-key and SNS token information

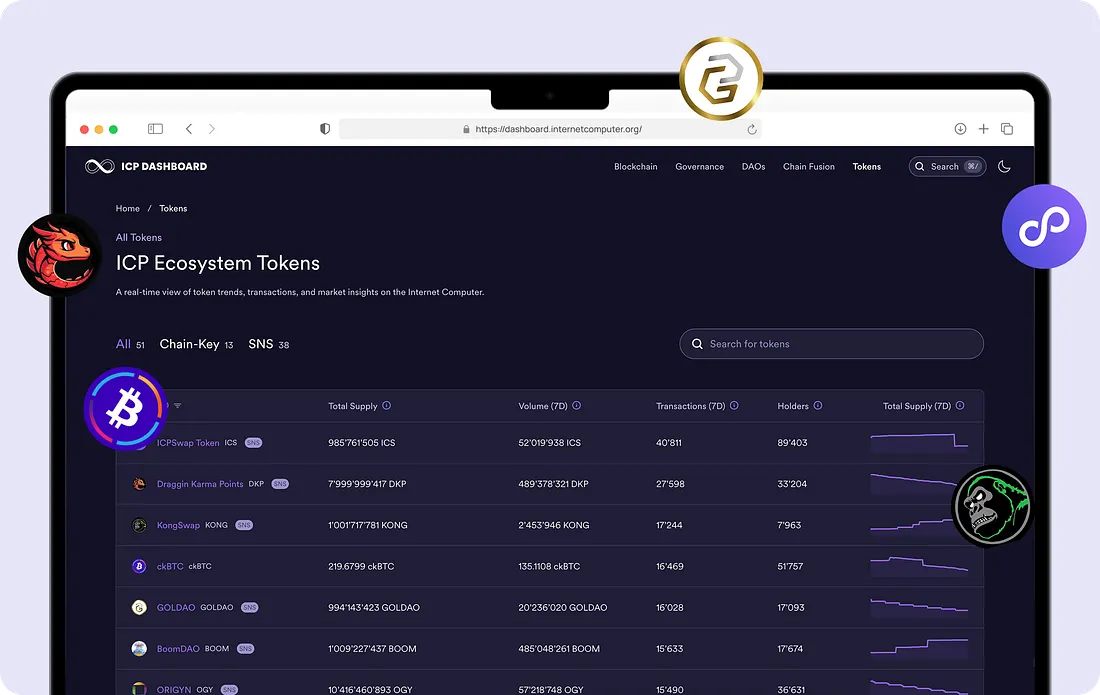
The planned expansion includes more token-level context: prices, volume, transaction activity, history, and deeper asset pages. This would make the dashboard more useful as an ecosystem data layer, not only as a network monitor.

Why DFINITY framed this as necessary

The core problem described in the article is fragmentation. The dashboard already had a lot of useful information, but users often had to jump between pages to understand what was happening. The update tries to make practical questions easier to answer:

  • What is happening on the Internet Computer right now?
  • Which projects or assets are showing momentum?
  • How are principals, canisters, tokens, SNS projects, and DAOs connected?
  • What does a specific canister do, and how can someone inspect it further?
  • How does a new token or DAO fit into the wider ecosystem?

Those questions are product-design questions as much as data questions. The value is not just adding more metrics, but arranging them so that different audiences can build a mental model of the network faster.

What was planned next

The article points to several follow-up directions:

  • Expanded support for ICRC-based and ecosystem tokens.
  • Price data aggregated from multiple sources.
  • Search across tokens, principals, canisters, and SNS projects.
  • More contextual pages that combine relevant data for a node, project, principal, or asset.

Together, these changes would make the dashboard feel more like a connected knowledge and analytics layer for the Internet Computer.

My takeaway

The interesting part of this update is the move from data availability to data comprehension. Publishing metrics is useful, but the harder product challenge is helping people understand what those metrics mean, how entities relate to one another, and where to look next.

For ICP, that distinction matters. The network has protocol-level infrastructure, onchain applications, token standards, SNS DAOs, chain-key assets, principals, canisters, and ecosystem projects. A dashboard that can connect those layers clearly becomes part of how people understand the platform itself.

Moving my portfolio on the Internet Computer

For a while, I wanted to create a personal website to showcase case studies and share my thoughts online. I looked at various options but wanted something different, something that gave me full control and was not too expensive. That’s how I ended up creating a custom website and hosting it in a non-traditional way using the Internet Computer blockchain.

DFINITY background

Understanding options for a portfolio website

When thinking about where to build my portfolio, I considered many options:

  • Figma and other design tools: Good for designers who want to quickly show their projects, but it doesn’t let you customize much. Not an option for a standalone blog.
  • Website builders like Readymag, Squarespace or WIX: They’re easy to use and look nice, but you can’t fully control everything or easily move your site elsewhere.
  • Social media like Instagram, X or LinkedIn: Great for meeting people and easy to use, but you can’t change much about how things look.
  • Webflow: Lets you change a lot, add cool effects, and is suitable for web designers. I was really considering this, especially since I used it to build websites for my clients, but I wanted to have even more flexibility and control.
  • Custom built websites: You can do whatever you want, but it needs coding skills.

Realizing that I’d put efforts into compiling portfolio case studies, writing blog articles — I wanted to have something that I’ll have full control of. I didn’t want to depend on a service that might shut down or terminate my access. So, I decided to build my website by myself.

Custom built website, why I chose Astro

I have development experience and am eager to learn more. After some research on currently popular frontend solutions, I picked Astro — a framework for content-driven websites.

Astro project structure for a content-driven portfolio site

I liked Astro right away because it simplifies things. For instance, to add a new project or write a blog post, I just create a new markdown file (.md), and the site automatically generates a page for it. This means I don’t have to worry about coding each page—just focusing on the writing part, which I find to be the most challenging.

So far, everything looks great. Building the actual layouts took some effort, but the way information is structured in Astro makes total sense. It has allowed me to easily build the site, focusing on sharing my projects and ideas without the technical hassle.

What is the Internet Computer?

The Internet Computer is an open and secure blockchain-based network that allows individuals to personally manage their data without relying on third-party solutions. All user data is stored in ‘canisters’, a unique storage solution on this platform. From a technical standpoint, websites are hosted on the blockchain, yet end users will not notice any difference compared to traditional hosting services.

🤙 What’s great about it

  • Complete ownership of your site and content.
  • No need to “register” anywhere, you basically get access to the blockchain with your Passkey (Internet Identity).
  • You don’t have to worry about someone else deciding to block or delete your site.
  • Very reliable — the network has never stopped working. However, it’s important to note that there have been times when it operated slower than usual.
  • Low costs: Approximately $5/year for a simple static website, provided it is not updated too frequently.

🚧 What’s not so great

  • It can be confusing at first with all the new words and steps.
  • If you want to do more than just show static pages, it gets more complicated, you actually need to dive into the IC developement and code canister smartcontract (on Rust or Motoko).

How to host on the Internet Computer

You need a few things to start

  • The source code for the website
  • Internet Identity - an authentication service for the Internet Computer. With this you can connect to most of the dapps on the Internet Computer (wallets, social medias, games, etc…). Takes a minute to create.

Manual way

In short, you’ll need to:

  1. Install IC SDK
  2. Understand some Internet Computer basics (what is a principal, how does the canister address look like, etc…)
  3. Have a cycles wallet that contains cycles (Cycles is like a gas on Ethereum but instead of users, developers pay for their canisters).
  4. Deploy an asset canister
  5. Configure your domain name to point to the canister url.

Official documentation for creating a sample project.

Host with Juno.build

It’s an open-sourced platform somewhat like Netlify or Cloudflare, but for Web3. As it explains on the Juno’s website — it’s a zero-knowledge blockchain platform that equips developers with all the essential tools to create any Web3 application, making it as easy as developing serverless Web2.

It provides a set of features like Authentication, Datastore, Storage, Functions, Analytics and Hosting. For hosting a static website we’ll only need the last one (and optionally Analytics).

In comparison to the manual way, you’ll not need to worry about Internet Computer SDK, getting cycles and reading through the documentation. For the start you’ll only need ~$5 worth of ICP tokens, and following basic instructions. Here is a good step by step tutorial.

Juno console interface for hosting a static website on the Internet Computer

Final thoughts

Building my website with Astro and using the Internet Computer for hosting was a big step for me. It was more than just making a site; it felt like I’m now getting a very private playground that only I can access, really personal and safe.

If you’re thinking about doing something similar, I say go for it. It might look hard at first with all the new stuff to learn, but it’s worth it. You get a website that you fully own and control, plus it’s safe and cheap to keep online. So, why not start? It’s a chance to make something cool and learn a lot along the way.